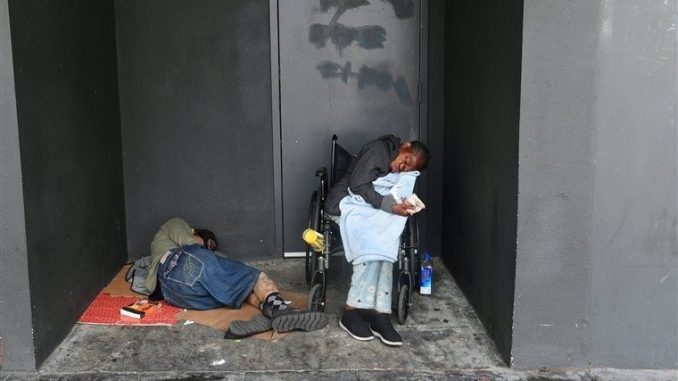
The gap between the haves and have-nots in the United States grew last year to its highest level in more than 50 years of tracking income inequality, according to Census Bureau figures.
Income inequality in the United States expanded from 2017 to 2018, with several heartland states among the leaders of the increase, even though several wealthy coastal states still had the most inequality overall, according to figures released Thursday by the U.S. Census Bureau.
The nation’s Gini Index, which measures income inequality, has been rising steadily over the past five decades.
The Gini Index grew from 0.482 in 2017 to 0.485 last year, according to the bureau’s 1-year American Community Survey data. The Gini Index is on a scale of 0 to 1; a score of “0” indicates perfect equality, while a score of “1” indicates perfect inequality, where one household has all the income.
The increase in income inequality comes as two Democratic presidential candidates, U.S. Sens. Bernie Sanders and Elizabeth Warren, are pitching a “wealth tax” on the nation’s richest citizens as a way to reduce wealth disparities.
The inequality expansion last year took place at the same time median household income nationwide increased to almost $62,000 last year, the highest ever measured by the American Community Survey. But the 0.8% income increase from 2017 to 2018 was much smaller compared to increases in the previous three years, according to the bureau.
Even though household income increased, it was distributed unevenly, with the wealthiest helped out possibly by a tax cut passed by Congress in 2017, said Hector Sandoval, an economist at the University of Florida.
(snip)
A big factor in the increase in inequality has to do with two large population groups on either end of the economic spectrum, according to Sean Snaith, an economist at the University of Central Florida.
On one side, at the peak of their earnings, are baby boomers who are nearing retirement, if they haven’t already retired. On the other side are millennials and Gen Z-ers, who are in the early stages of their work life and have lower salaries, Snaith said.
“I would say probably the biggest factor is demographics,” he said. “A wealth tax isn’t going to fix demographics.”
The area’s with the most income inequality last year were coastal places with large amounts of wealth — the District of Columbia, New York and Connecticut, as well as areas with great poverty — Puerto Rico and Louisiana.
Utah, Alaska, Iowa, North Dakota and South Dakota had the most economic equality.
Three of the states with biggest gains in inequality from 2017 to 2018 were places with large pockets of wealth — California, Texas and Virginia. But the other six states were primarily in the heartland — Alabama, Arkansas, Kansas, Nebraska, New Hampshire and New Mexico.
A variety of factors were at play, from a slowdown in agricultural trade and manufacturing to wages that haven’t caught up with other forms of income, economists say.
While some states have raised the minimum wage, other states like Kansas haven’t. At the same time, the sustained economic growth from the recession a decade ago has enriched people who own stocks, property and other assets, and have sources of income other than wages, said Donna Ginther, an economist at the University of Kansas.
“We’ve had a period of sustained economic growth, and there are winners and losers. The winners tend to be at the top,” Ginther said. “Even though we are at full employment, wages really haven’t gone up much in the recovery.”
*see full story by NBC News